What is changing across an industry, and why it matters.
Industry Intelligence connects valuation trends, KPI premiums, market events and M&A activity into one evidence-led read of a sector, before drawing implications for a specific company.
Start with the sector dashboard, not a headline statistic.
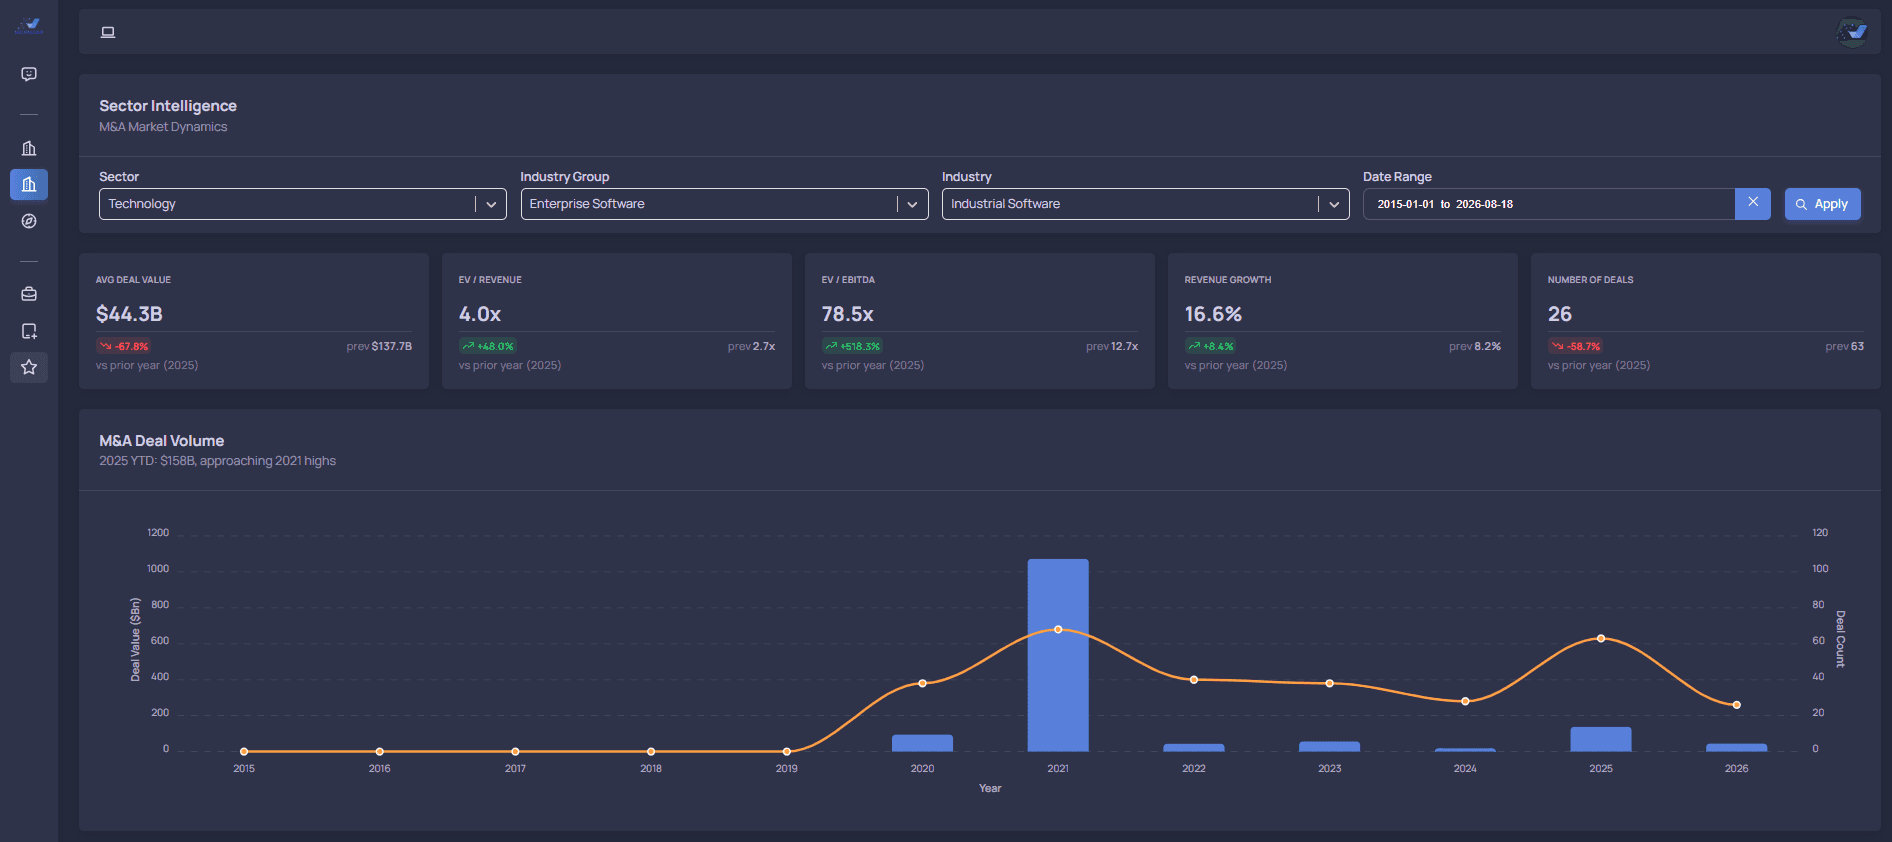
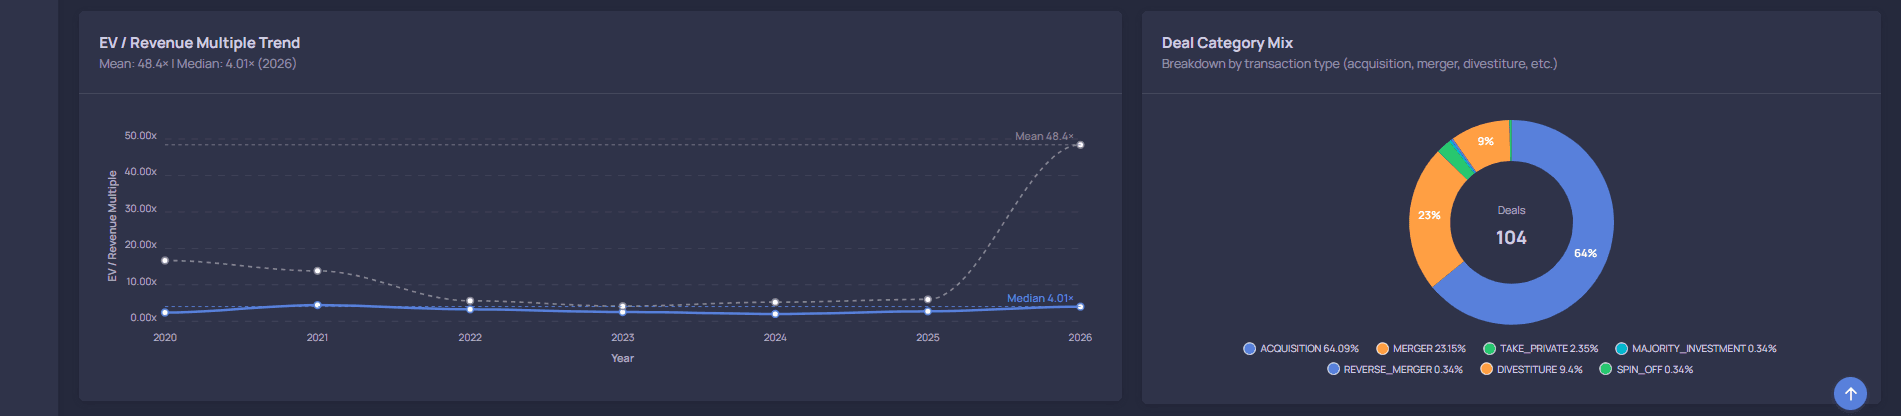
The industry view brings deal volume, deal-category mix, valuation multiples and recent transactions into one dashboard so a reader can see the market before interpreting an individual data point.
Read the market in four connected layers.
Each module below is a real NeuraCap analytical surface. Specific figures, dates and named transactions are supplied by the underlying report data at the time it is generated, not invented for this page.
Valuation multiple trend
EV/Revenue and EV/EBITDA trends across the sector over the selected period, so an individual company or transaction can be read against the range.
KPI-to-premium map
Which operating and financial metrics are associated with higher or lower valuation multiples inside the peer set.
Market-event timeline
Earnings, guidance changes, M&A announcements and material filings, each dated and sourced, aligned against market reaction.
Notable M&A transactions
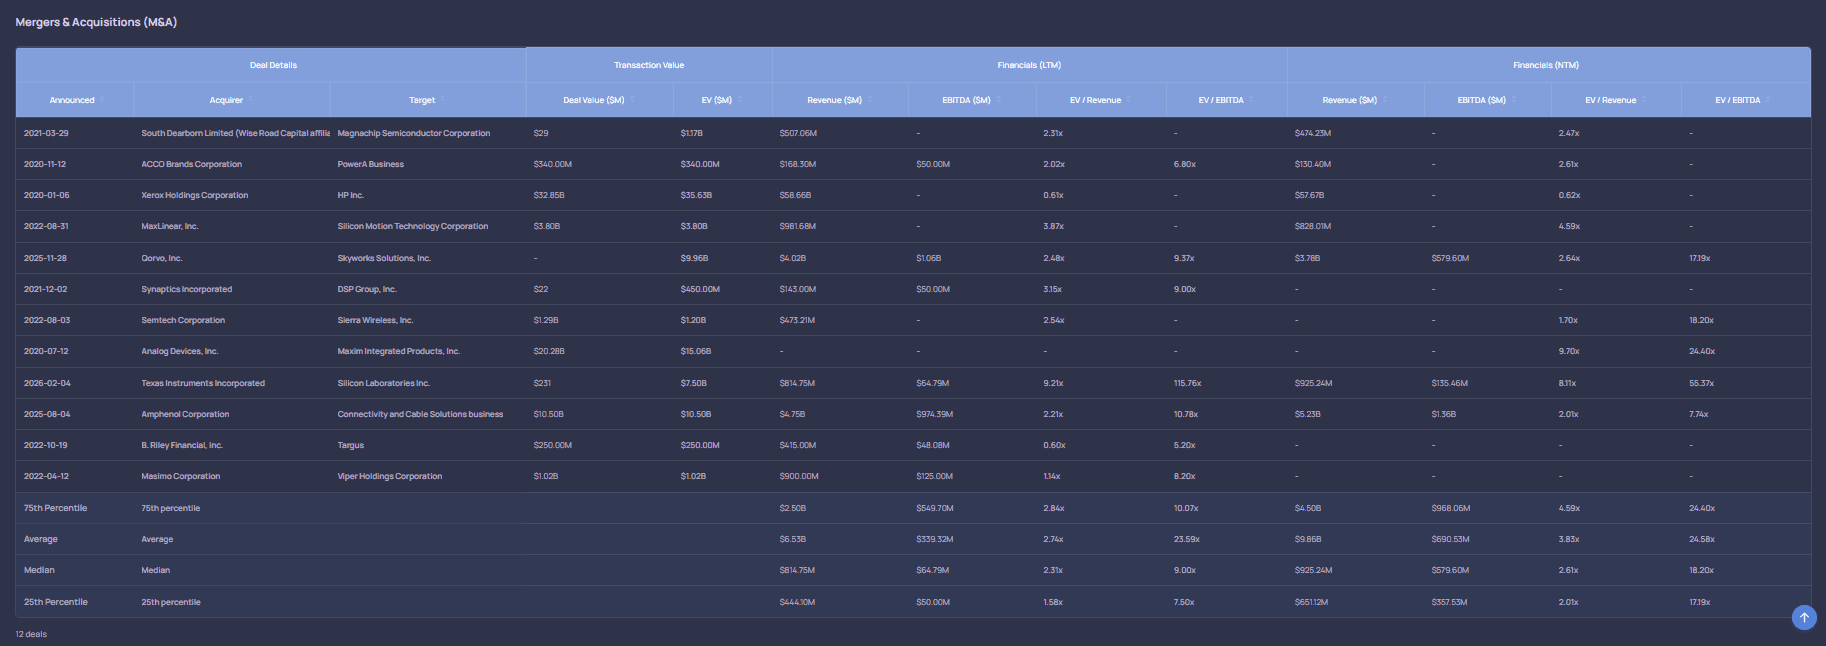
Recent and historical deals in the sector, with transaction value, EV/Revenue and EV/EBITDA context.
Evidence, not just a conclusion.
Transaction evidence sits beneath the sector narrative so a reader can inspect the deals behind a valuation-trend claim.
What changed: the report states the specific shift observed in the selected period (e.g. multiple expansion, a wave of consolidation, or a change in buyer mix).
Why it matters: the report connects that shift to the operating or strategic factors the evidence supports, without asserting causation the data cannot show.
What management should investigate: the report closes with specific, evidence-linked questions for a management team in the sector, not a generic call to action.
Read the summary. Generate the deeper analysis when you need it.
Every industry report keeps a public executive summary indexable, even when the full report requires product access.
This analysis is based on the sources, assumptions and as-of dates shown. It is not a recommendation, offer or solicitation to buy, sell or hold any security or enter any transaction. AI-assisted interpretations may contain errors or omissions. Verify source data and consult qualified advisers before making financial, transaction, legal, tax or accounting decisions. Past transactions, market performance and valuation relationships do not guarantee future results.
Company, peers, transactions, valuation connected.
Request a demo to see the NeuraCap company-evaluation workflow applied to a company in your sector.