See where the company stands, what drives its premium and what to improve.
A company-specific report connecting peer KPI gaps, premium and discount drivers, strategic opportunities, risks and a valuation roadmap into one evidence-led view.
Benchmark first. Interpret second.
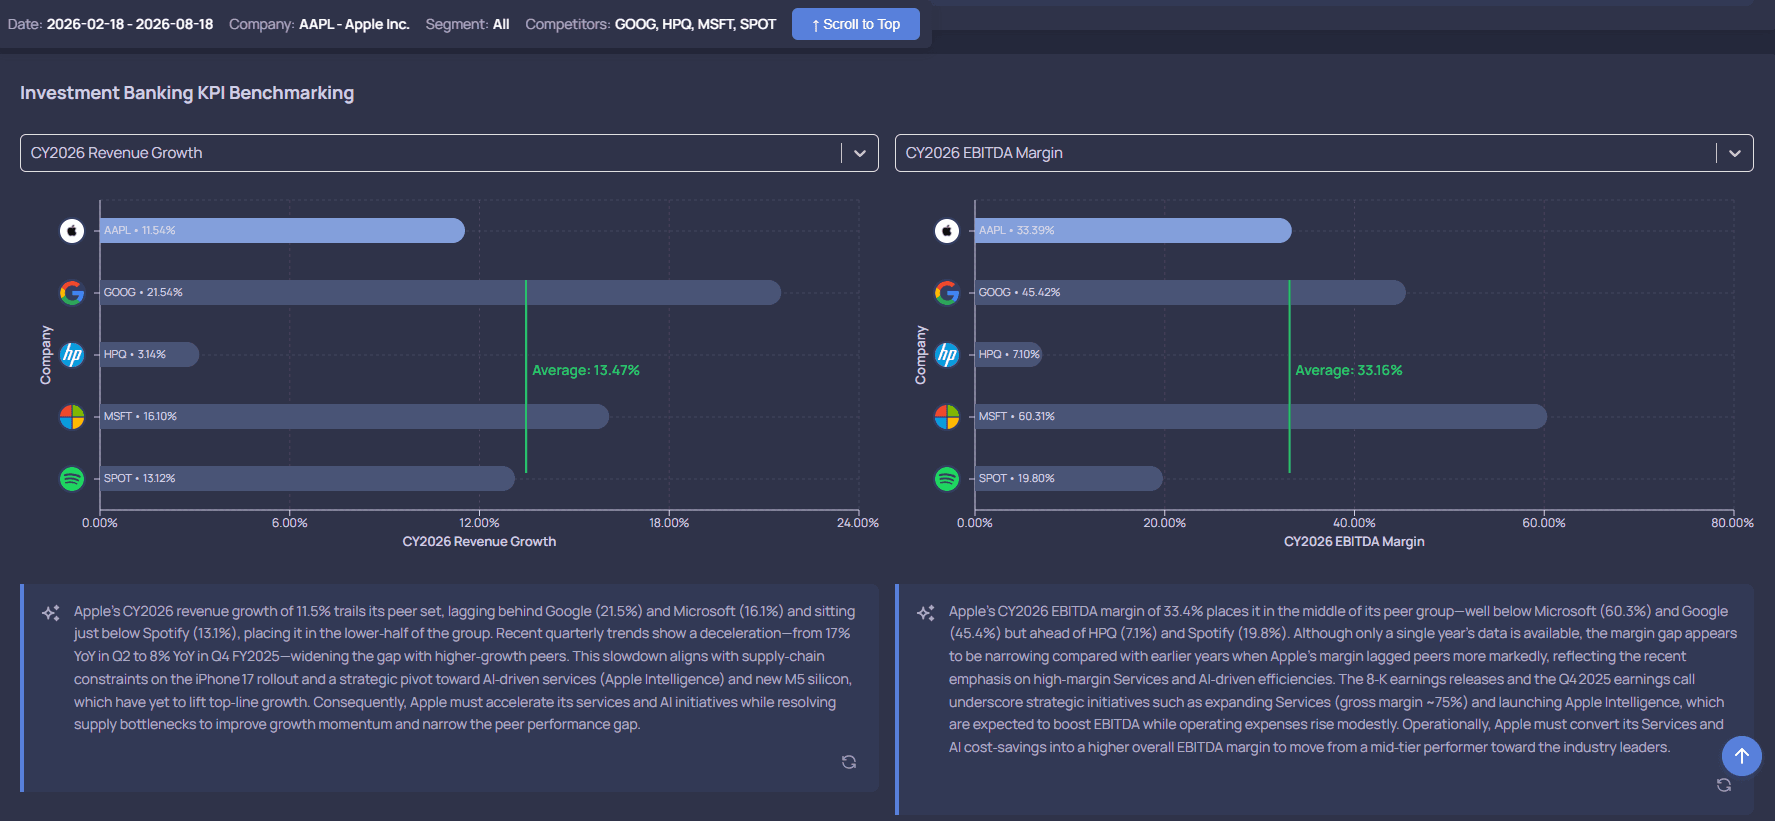
Company Strategic Analysis starts with the same KPI-benchmarking surface used across NeuraCap: the selected company compared with a relevant public peer set across financial, operating and valuation metrics.
This page uses a real, unlabeled NeuraCap product screenshot as structural evidence. No specific company facts are shown until an approved example or a live user session supplies them.
Six sections, one connected diagnostic.
Each section below answers a specific management question rather than repeating the same metrics table with new headings.
Peer KPI gaps
Where the company sits above, below or in line with its peer set on the metrics that matter most.
Premium / discount drivers
Which KPIs are associated with the peer set's highest and lowest valuation multiples.
Strategic opportunities
Adjacent capabilities, M&A themes or operating changes suggested by the peer and transaction evidence.
Risks
Where the evidence points to a structural disadvantage or exposure relative to the peer set.
Valuation roadmap
The milestones associated with a stronger relative position: see the full Valuation Roadmap report .
Management review areas
Specific, evidence-linked questions for the next strategy or board discussion.
Public-peer financials, market data and precedent transactions come from licensed and public sources. Company-specific inputs a user provides (for a private company, or additional context for a public one) are clearly labelled as user-provided and are not verified by NeuraCap.
Every insight in the report should be traceable back to one of these two layers, not blended into an unexplained conclusion.
Open or generate the full company report.
A public executive summary stays indexable; the full report, including the interactive peer set and NeuraCap Advisor discussion, opens in the product.
This analysis is based on the sources, assumptions and as-of dates shown. It is not a recommendation, offer or solicitation to buy, sell or hold any security or enter any transaction. AI-assisted interpretations may contain errors or omissions. Verify source data and consult qualified advisers before making financial, transaction, legal, tax or accounting decisions. Past transactions, market performance and valuation relationships do not guarantee future results.
Company, peers, transactions, valuation connected.
Request a demo to see the NeuraCap company-evaluation workflow applied to a company in your sector.