
Company Analysis: one company, one evidence chain.
Evaluate a public or private company through executive context, competitor metrics, KPI benchmarking, market data, valuation and relevant transaction context.
Start with the company. Build the evidence around it.
Company Analysis is the core evaluation workspace. It brings the company summary, comparable companies, KPI benchmarks, market data and valuation surfaces into the same analytical thread.
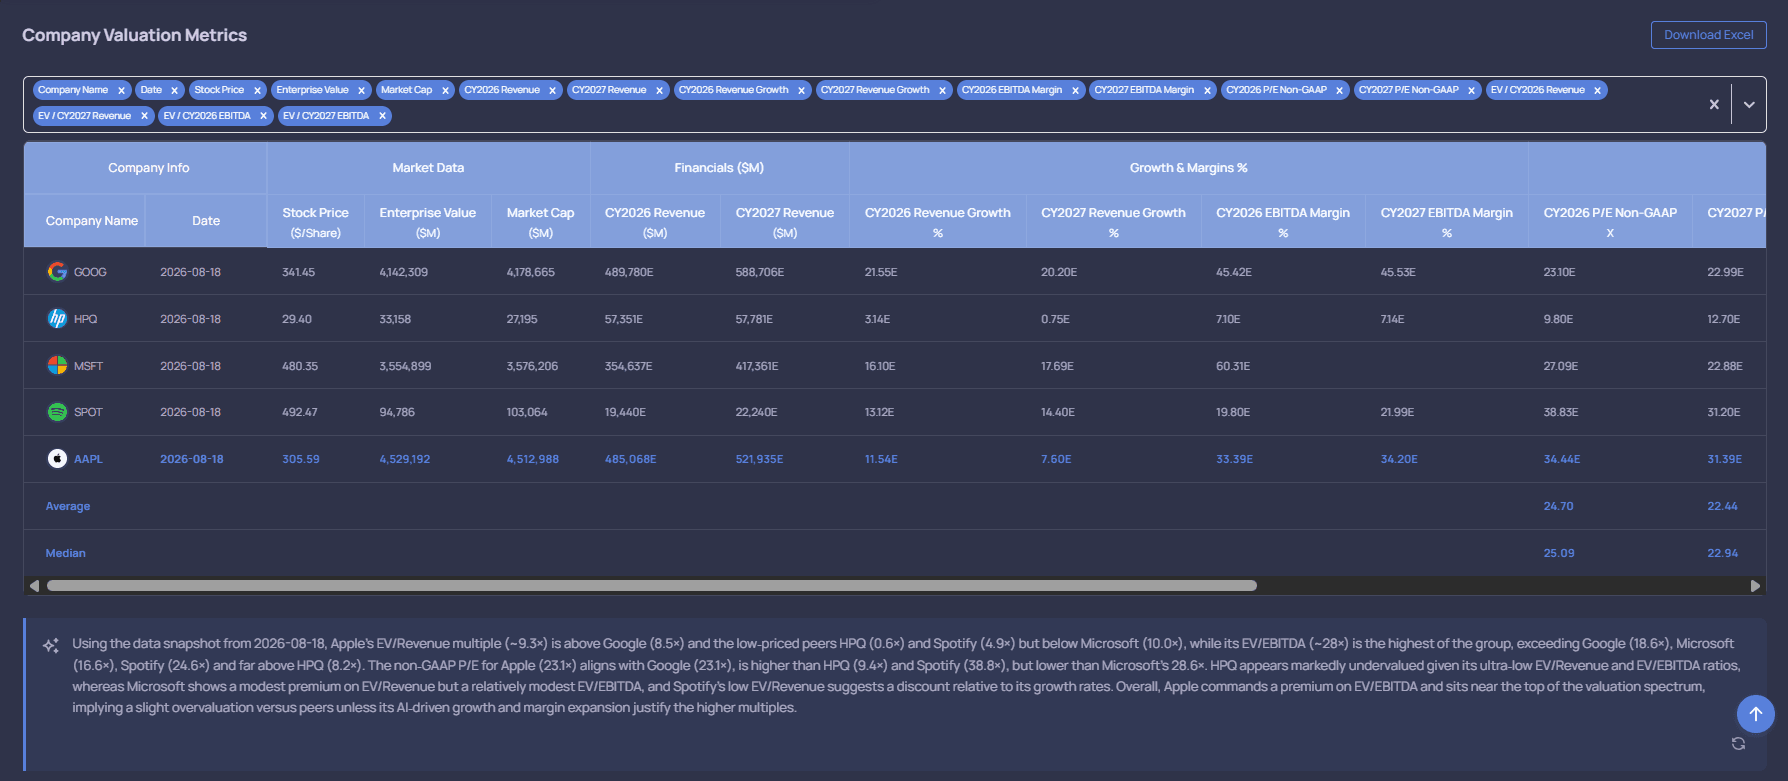
See the company and its competitors in the same frame.
The peer table is the reference layer for everything that follows. It can combine current market information with reported and forward financial metrics so the analyst can understand relative positioning before interpreting the charts.
Market data
Public-company market context and valuation fields provide the starting point for relative analysis.
Reported financials
Historical reported metrics are structured for comparison across the selected company set.
Forward estimates
Forward consensus estimates are shown separately from reported figures and remain subject to revision.
Compare the operating story with a horizontal peer chart.
The KPI Benchmarking surface compares the selected company with competitors across relevant operating and financial KPIs. The current product screen already provides the clearest approved evidence, so the page uses that screen directly rather than adding an artificial placeholder.
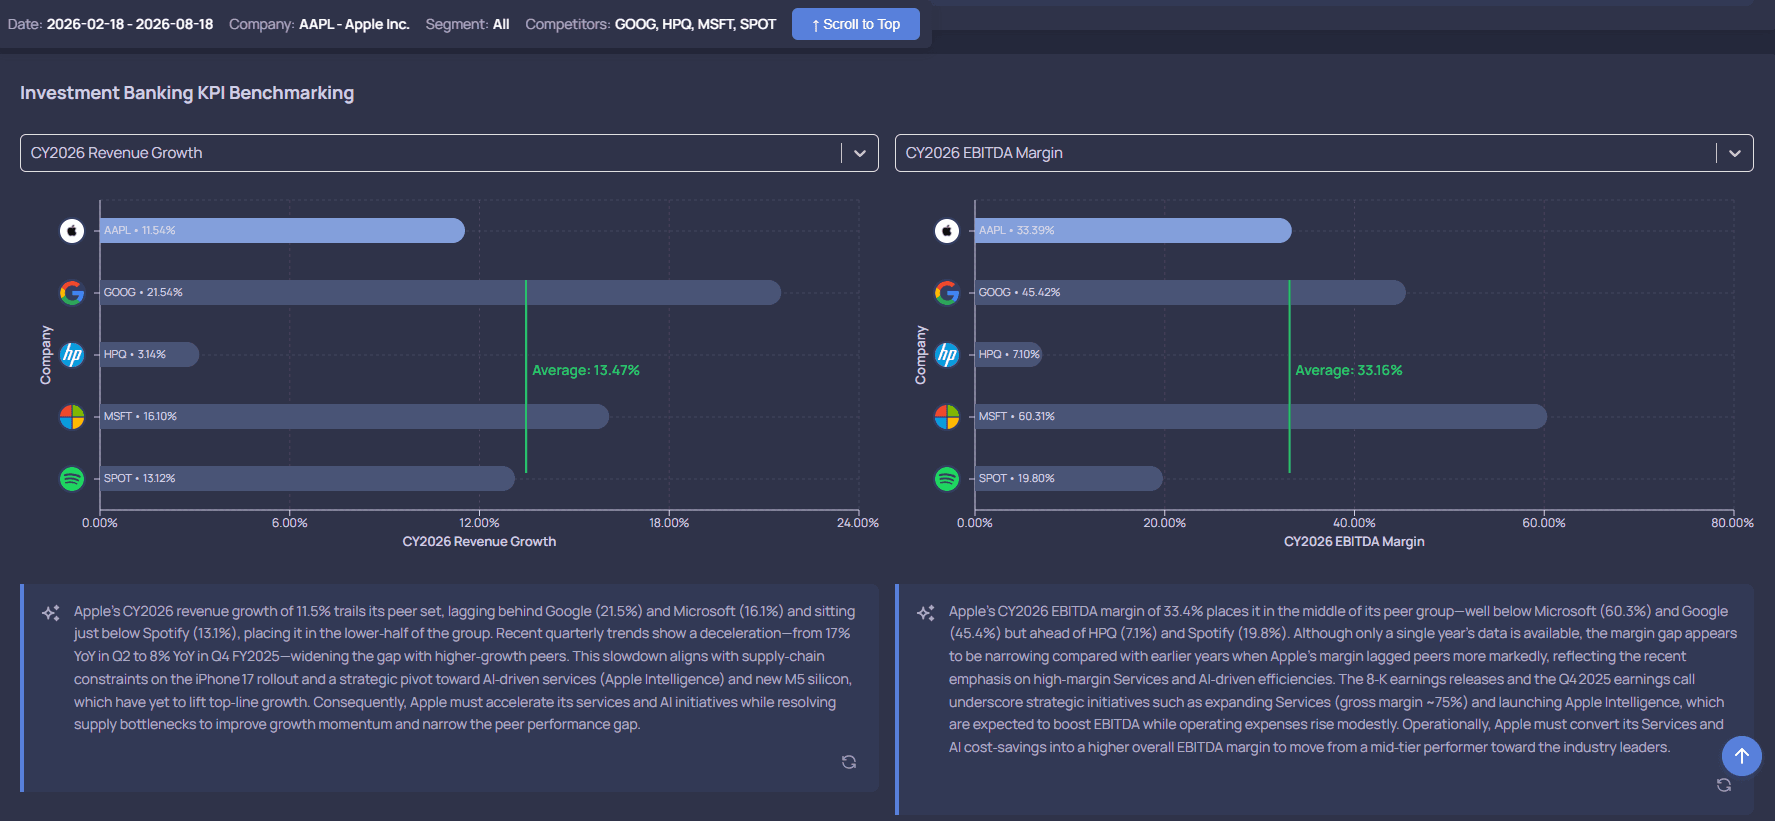
Growth and margin
Revenue growth, EBITDA margin and other relevant KPIs can show whether the target sits above, below or around its peer set.
Percentile positioning
Benchmarking becomes useful when the analyst can see relative positioning rather than a list of disconnected numbers.
Move from company metrics to market behavior.
The market-data surface provides historical price context and related market fields for public companies. A dedicated candlestick/OHLCV capture is not in the approved asset set yet, so this section documents the workflow without inventing a chart.
Turn multiple evidence layers into a valuation range.
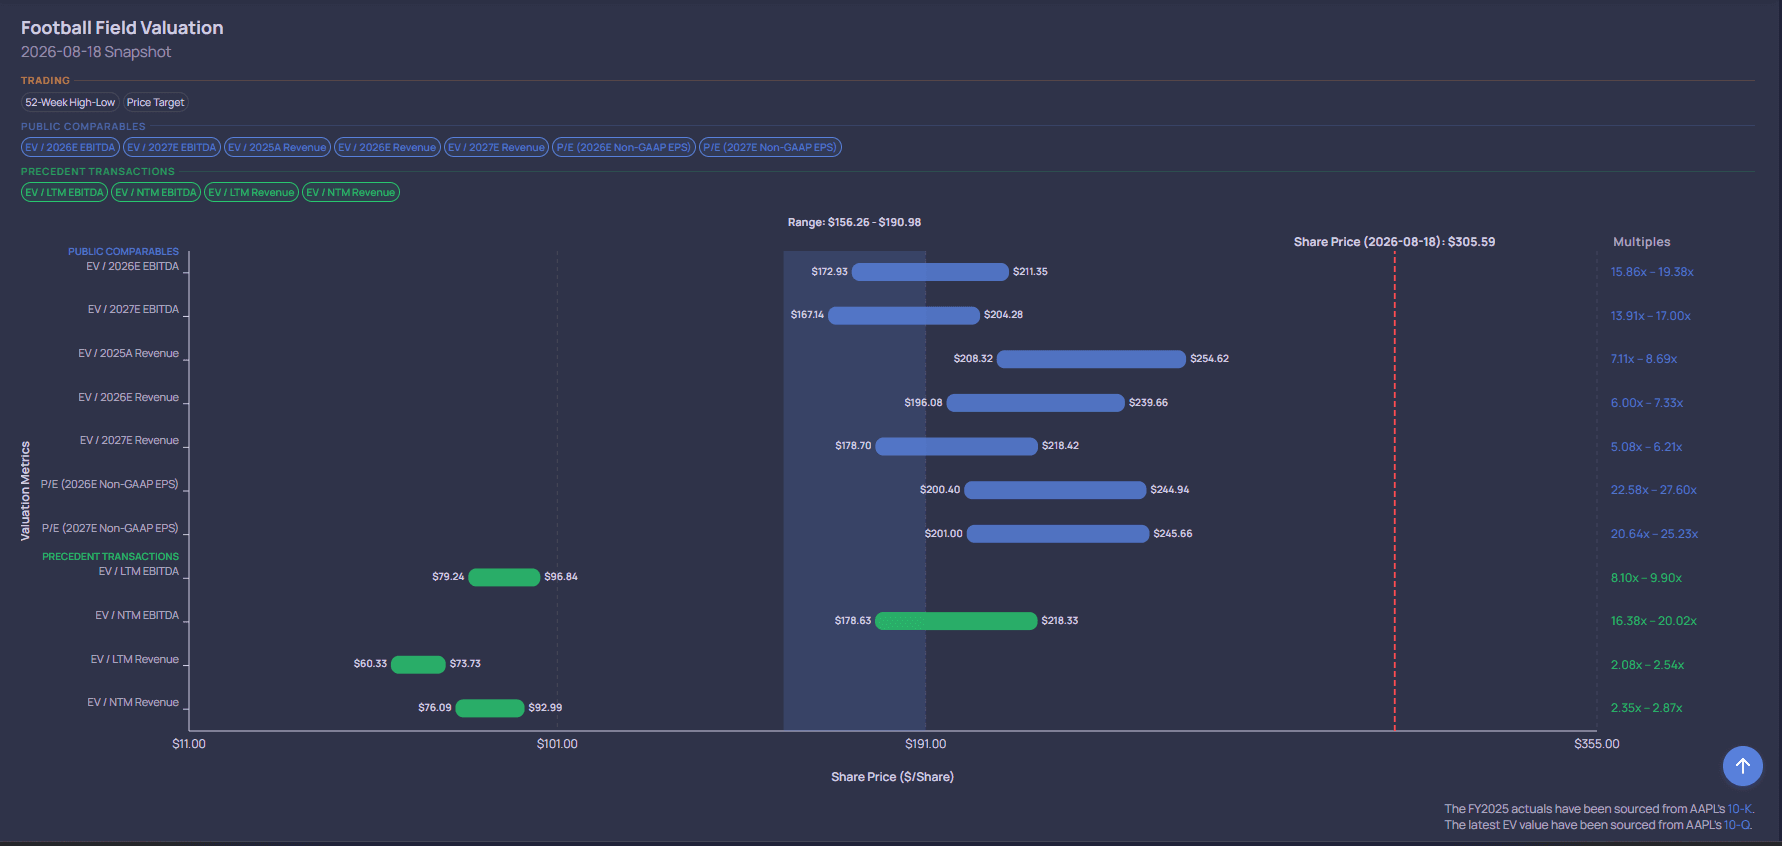
The Football Field brings valuation ranges into one investment-banking presentation surface. It can show public-comparable and transaction-based ranges alongside other supported methodologies.
- Public company comparables
- Precedent transactions
- Methodology ranges
- Implied aggregate valuation context
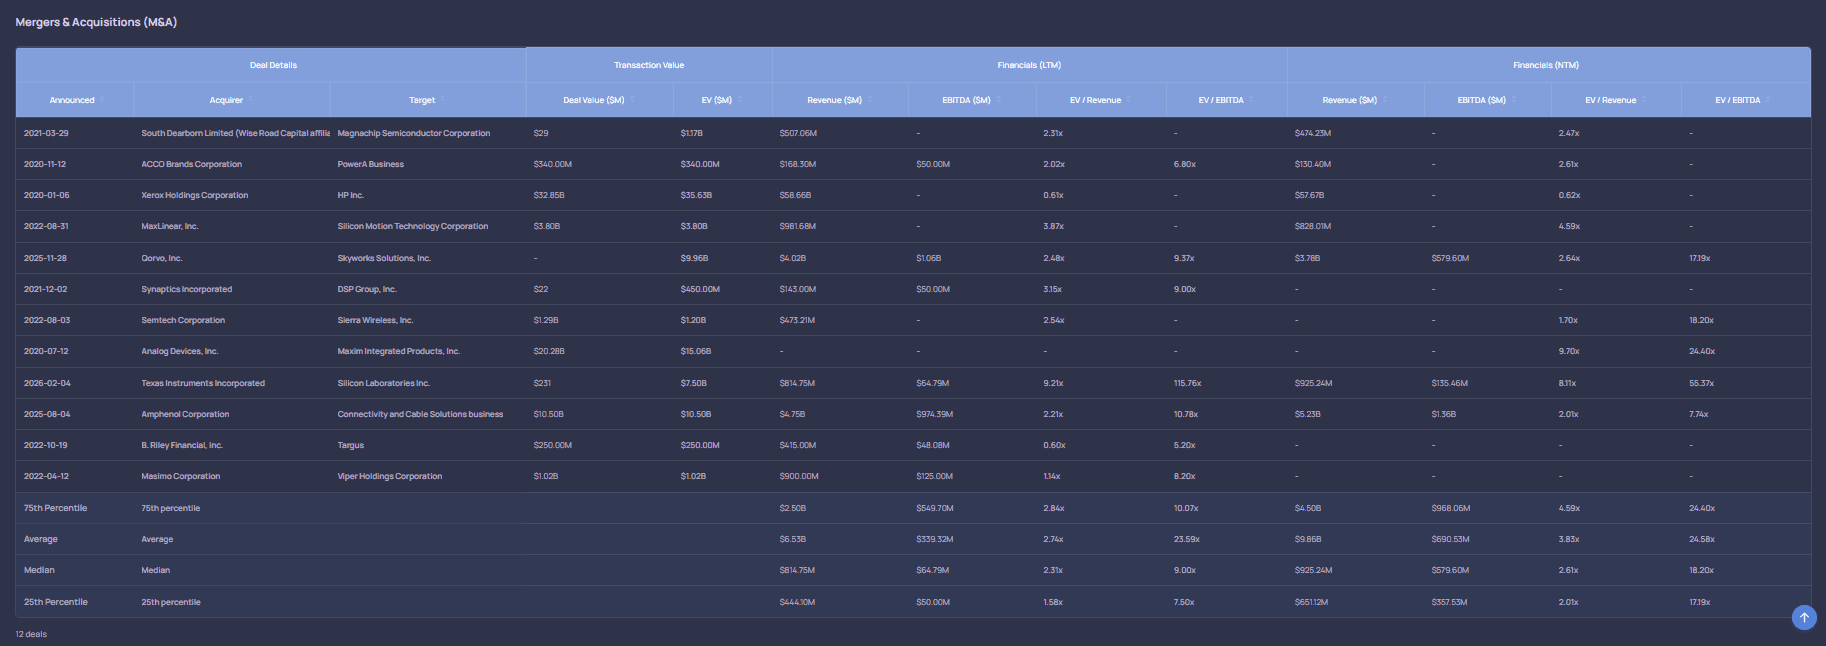
Company Analysis can carry relevant M&A evidence into the valuation story.
The dedicated M&A surface is where transaction research happens in depth. Company Analysis uses the relevant transaction context as another evidence layer rather than treating M&A as a completely separate product.
The chart is only useful when the evidence behind it is coherent.
Company Analysis is designed to move from raw company context to relative benchmarking and then to valuation. The analyst remains responsible for selecting the right peers and interpreting the result.
Evaluate more companies with less manual research.
Request a demo to see NeuraCap applied to the company-evaluation workflow.