
Strategic intelligence that keeps pace with the market.
Explore NeuraCap reports that connect industry shifts, M&A activity, valuation, buyer behaviour and company-specific implications.
Eight report categories, one connected evidence layer.
Every category below links to a dedicated report page with real NeuraCap product evidence, source scope and disclosure context. Categories without an approved live report export are labelled illustrative rather than shown with invented data.
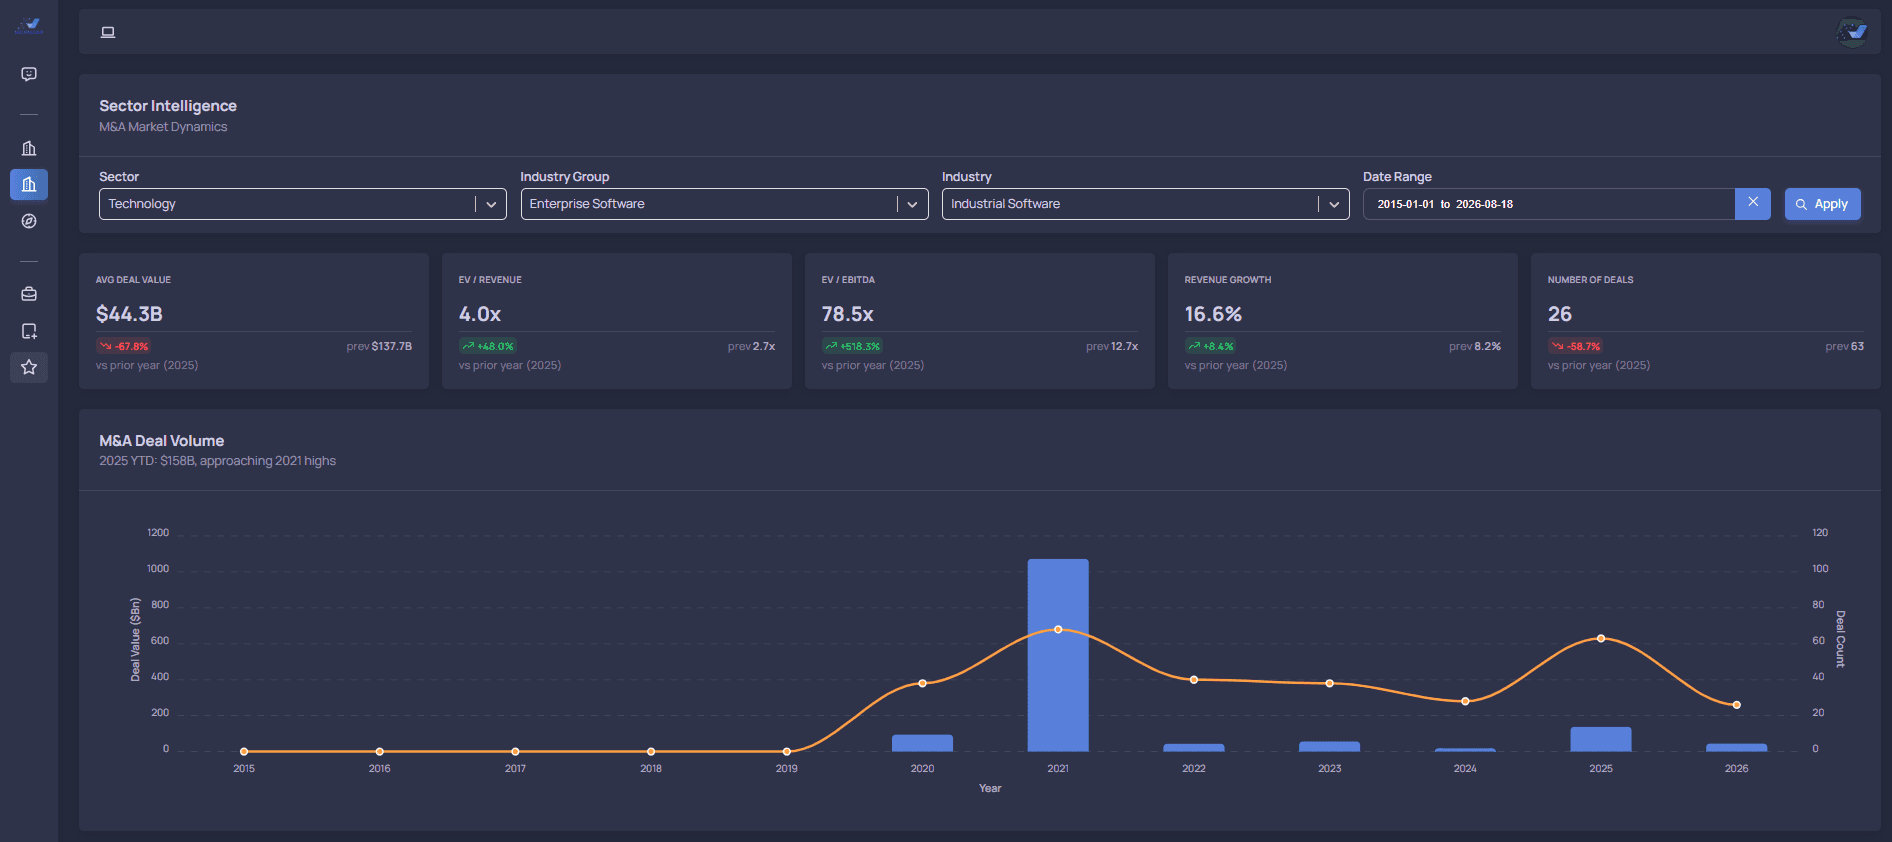
Industry Intelligence
What is changing across an industry, why valuations are moving, and where M&A is occurring.
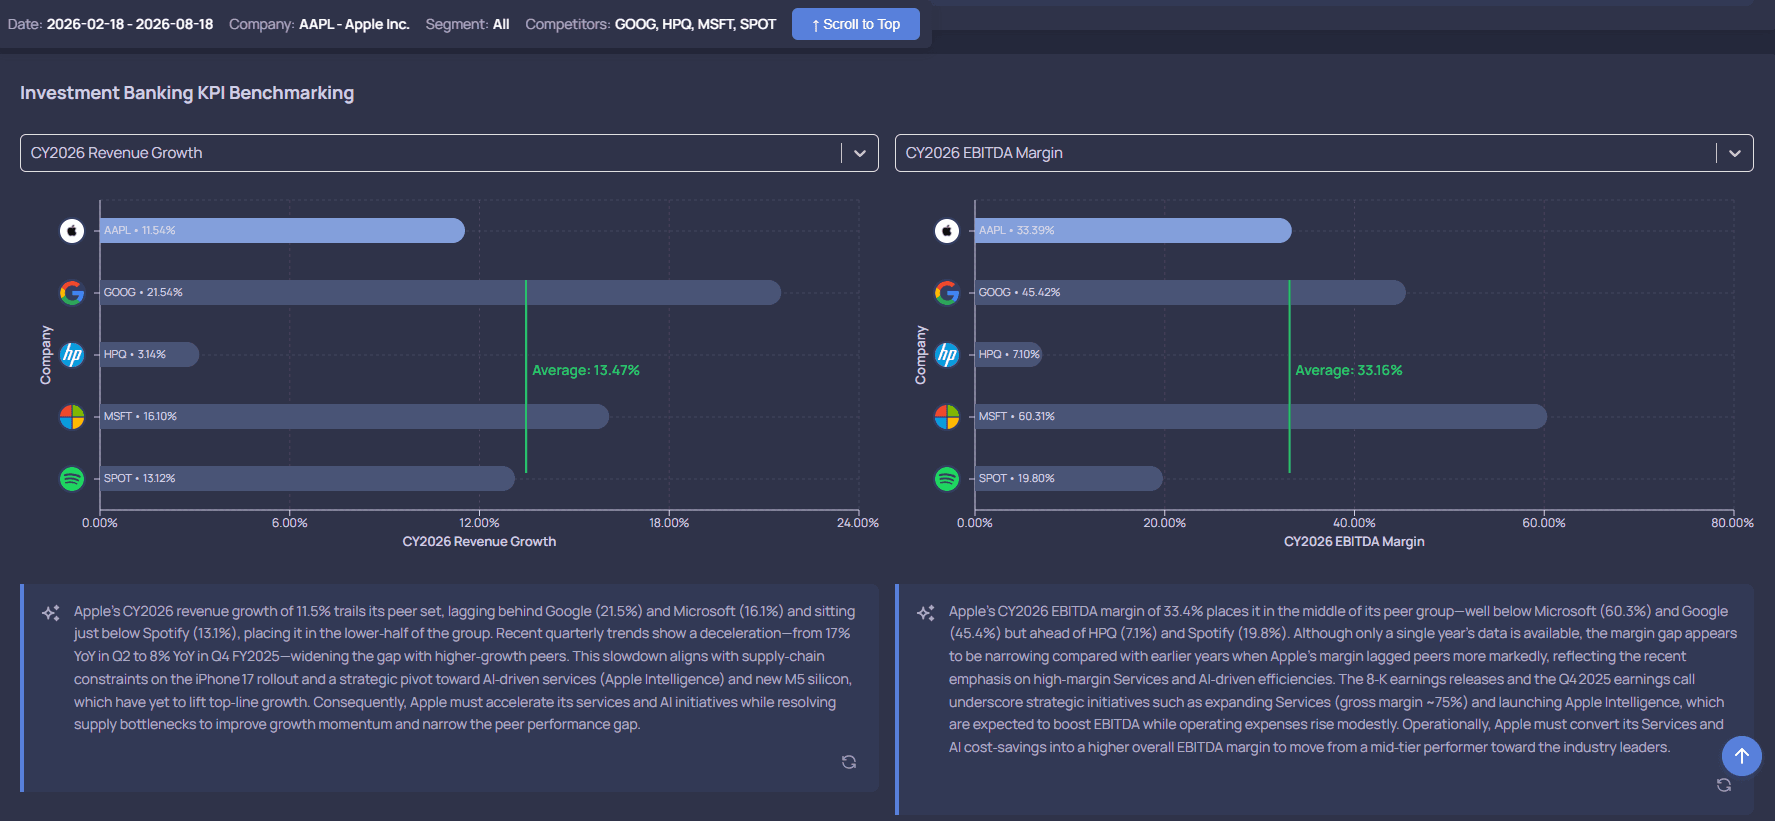
Company Strategic Analysis
Competitive positioning, financial benchmarking, valuation and strategic opportunities for one company.
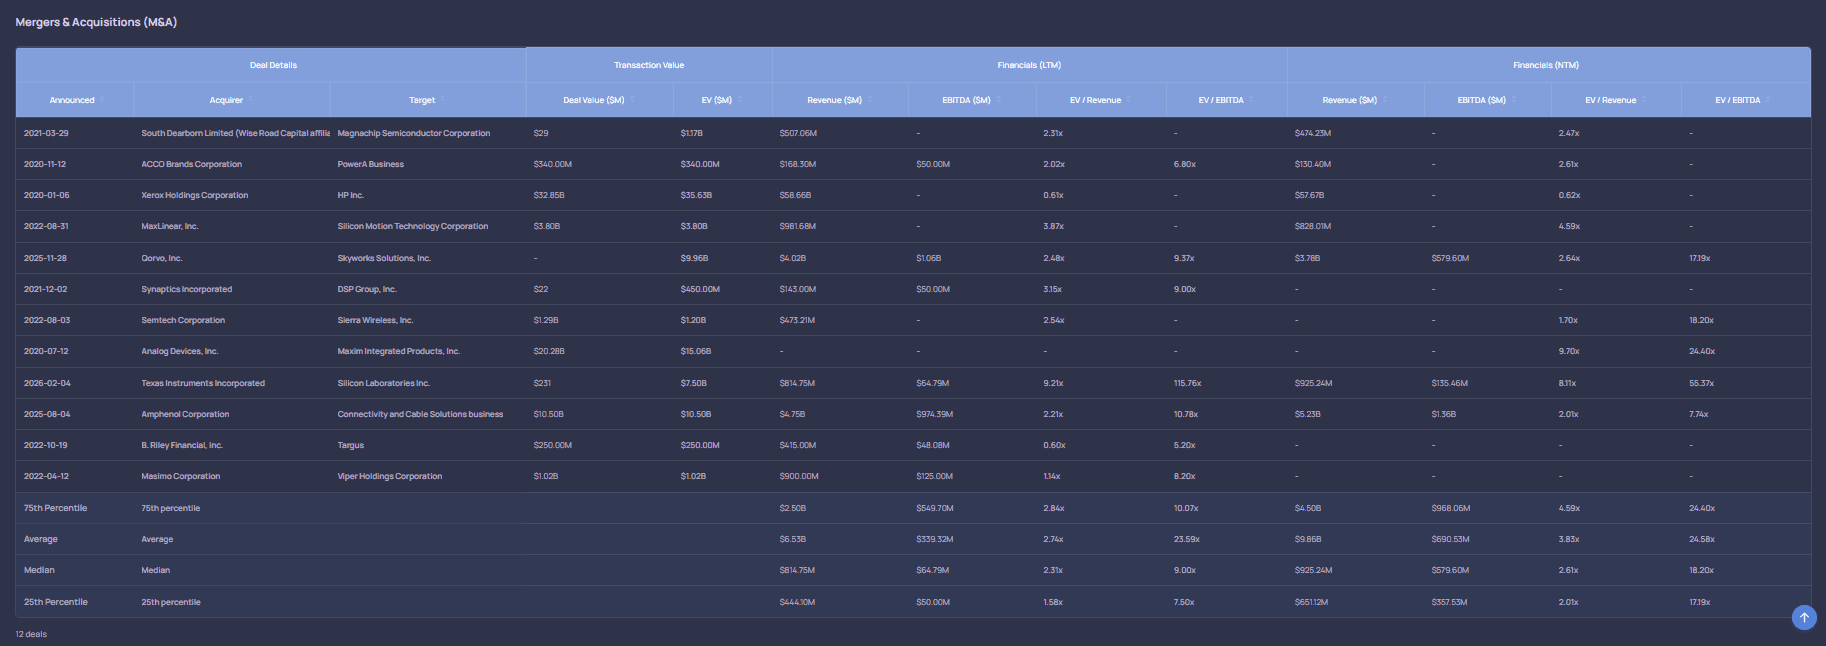
M&A Opportunities
Potential acquisitions, consolidation strategies, adjacencies and strategic rationale.
Strategic Buyer Landscape
Who can buy, historical acquisition behavior and strategic fit, evidenced by transaction history.
Valuation Roadmap
Financial and strategic milestones associated with premium valuations.
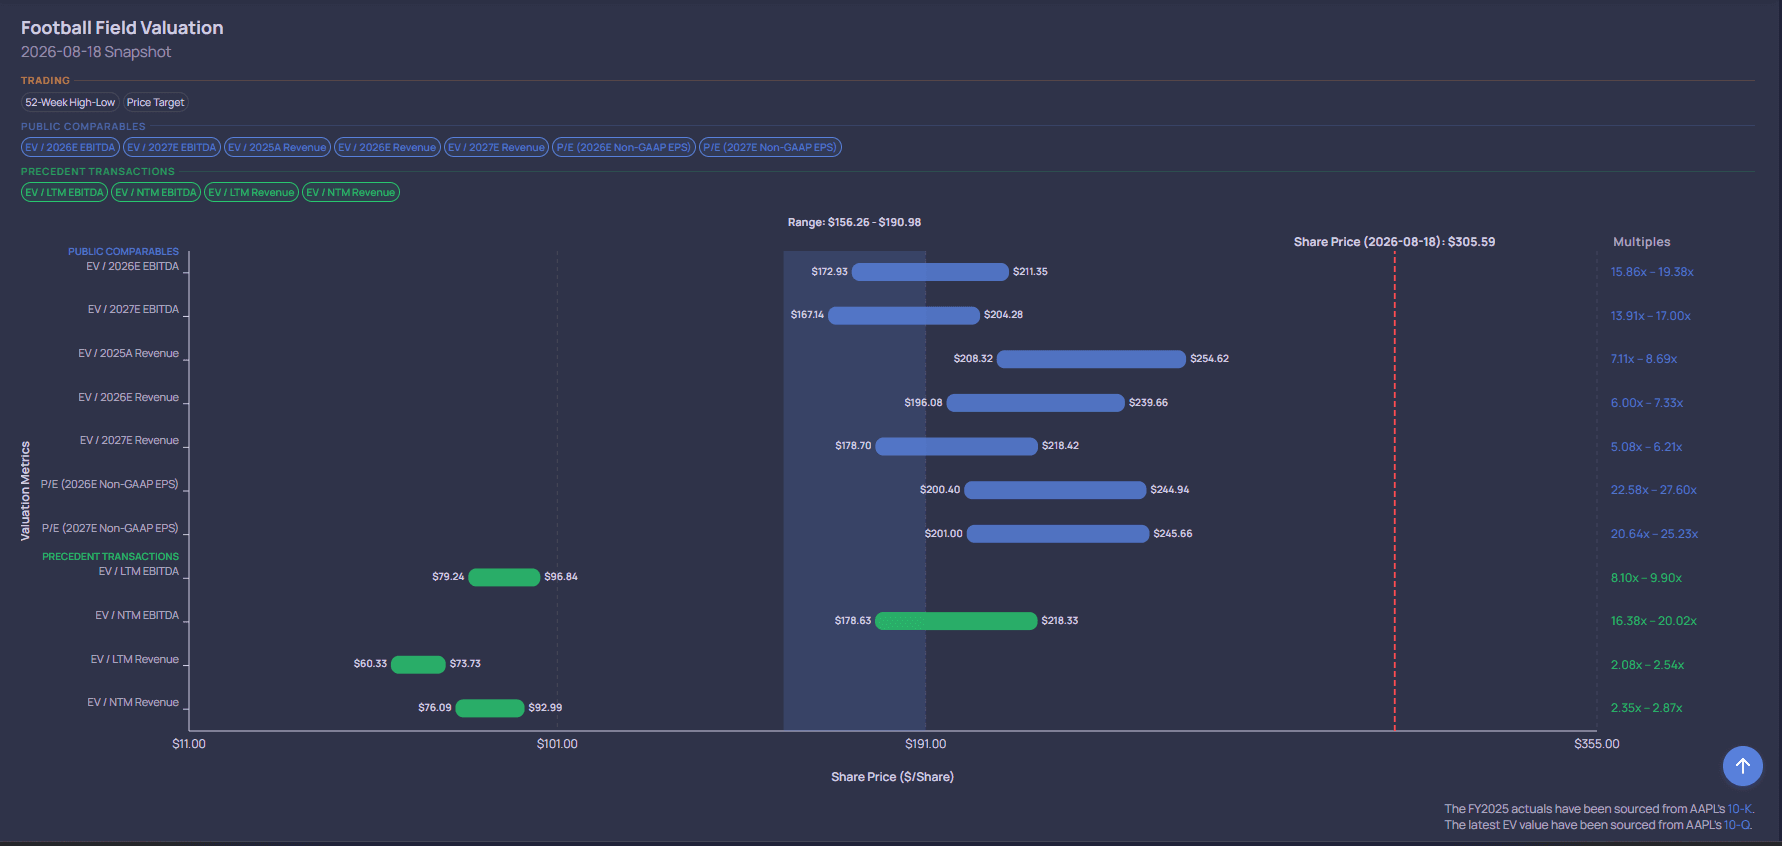
Public-Market Re-Rating
Why public peers gained or lost valuation premium, and what patterns may be relevant to management.
Capital Allocation
Which reinvestment, M&A, buyback or other capital strategies coincided with durable value creation.
Weekly Strategic Intelligence
What changed this week across valuation, M&A, peers and the market, and why it matters.
Every report shows its report type, scope and source.
Report cards do not display a fabricated “as of” date or a claim of continuous refresh unless the underlying date is real. Where a live date is not yet wired to this marketing site, cards say so explicitly.
Report type
Industry, company, M&A, buyer, valuation or market-structure report, plus the data sources behind it.
Source, not just a score
Reports lead with the underlying filings, transactions and market data, not an unexplained conclusion.
Generate deeper analysis
Open a category to see a full public executive summary, then request the deeper company- or industry-specific analysis.
Built for companies and finance professionals alike.
Both audiences use the same intelligence engine. Companies use it to understand their own market position; finance professionals apply it across more companies, sectors and mandates.
This analysis is based on the sources, assumptions and as-of dates shown. It is not a recommendation, offer or solicitation to buy, sell or hold any security or enter any transaction. AI-assisted interpretations may contain errors or omissions. Verify source data and consult qualified advisers before making financial, transaction, legal, tax or accounting decisions. Past transactions, market performance and valuation relationships do not guarantee future results.
Company, peers, transactions, valuation connected.
Request a demo to see the NeuraCap company-evaluation workflow applied to a company in your sector.