
Football Field: make the valuation range visible.
Valuation is a major analytical surface inside Company Analysis. This page explains the chart itself while keeping the product architecture honest.
Multiple methodologies. One presentation-ready view.
The Football Field can bring public comparable and precedent transaction ranges into a single visual so an analyst can communicate valuation context without manually rebuilding the chart.
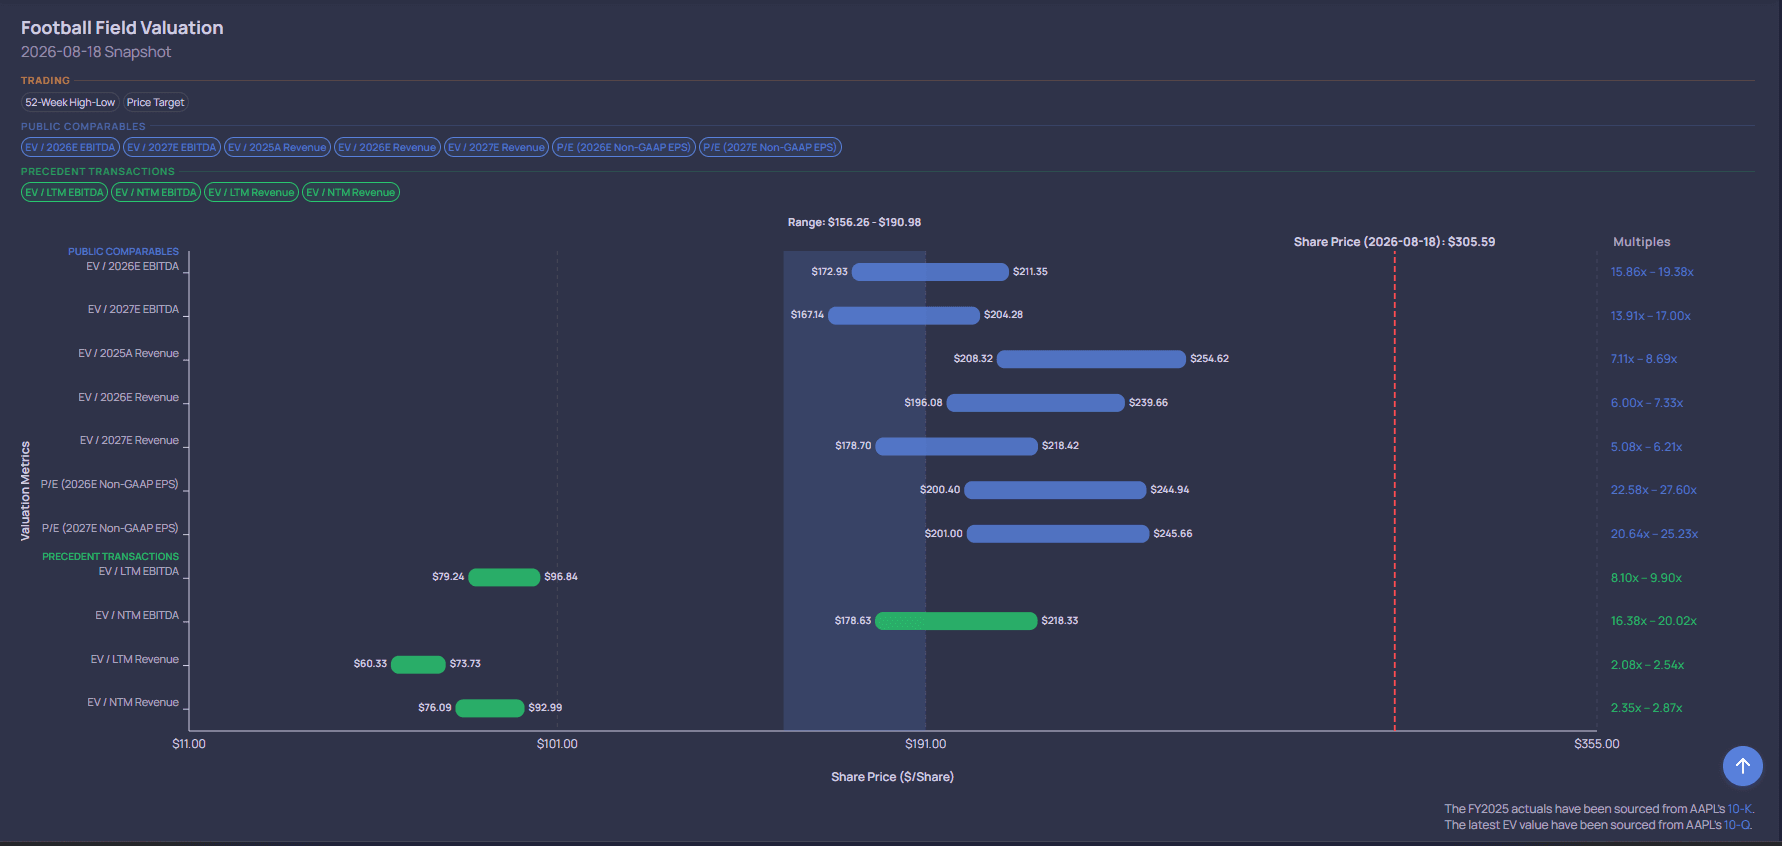
The chart is a summary of evidence, not a black box.
The supporting peer, transaction and financial inputs should remain visible in the broader Company Analysis workflow so the analyst can understand what sits behind each range.
Comparable companies
Relevant peer metrics provide one market-based valuation reference.
Precedent transactions
Comparable deals provide transaction-market evidence.
Football Field
Ranges are assembled into a familiar investment-banking visualization.
Evaluate more companies with less manual research.
Request a demo to see NeuraCap applied to the company-evaluation workflow.